This article originally appeared in the November 2008 HS Dent Forecast Newsletter. In the year and a half that has passed, the key insights remain: this recession is fundamentally different from all others of the post-WWII era.
On Friday, October 24, 2008, the Financial Times reported that swap spreads turned negative. It would be easy to dismiss this headline as just another bit of media noise except for one little technicality: according to all of the rules of finance, it is a mathematical impossibility. A negative swap spread means that the Treasury yield is higher than that of a swap of a similar maturity. As the “risk free” rate in virtually all financial models, the Treasury should always give the lowest taxable yield without exception. The pricing in the swaps market implies that the private issuers of swaps are somehow less risky than the U.S. government! Of course, this is absurd. All doubts about the fiscal responsibility of the government aside, no private company can ever be less risky than the U.S. government. With unlimited ability to tax and, if need be, print the needed money, a sovereign government by definition cannot default on debts denominated in its own currency.
Meanwhile, across the Atlantic, we found another absurd anomaly. Volkswagen briefly became the most valuable company in the world! A rush of panicked short covering caused the stock to triple in one day before finally easing to lower, albeit still grossly overvalued, price. Short sellers of Volkswagen found themselves wiped out…in the middle of an economic contraction that has decimated the auto industry.
Nassim Nicholas Taleb must be proud: “Black Swan” has become a standard expression in the American financial vocabulary, and his 2007 book by that name could not have been timelier. In Taleb’s context, a Black Swan is a high-impact, low-probability event beyond the realm of normal expectations, something along the lines of a tornado or earthquake in the natural world. Such natural disasters are highly destructive when they hit, but they are infrequent enough to make living in high-risk places such as Oklahoma or California possible and, in a financial context, affordable to insure. The problem, as Taleb repeats throughout his writings, is that in financial markets, “low-probability” events are a lot more common than our standard models allow.
What we witnessed in October 2008 was no doubt a Black Swan: the systematic deleveraging of the world financial system: essentially the biggest margin call in history, in which virtually all assets, regardless of quality, were simultaneously dumped. The major world stock indices fell for eight consecutive days and were down more than 20% in one week! Carefully diversified portfolios offered little protection as correlations between asset classes approached 1. No mainstream financial model—be it quantitative, fundamental, or technical—would have predicted such a large move in such a short time frame. Risk management fell woefully short in predicting the crash and in protecting investors.
We first addressed the shortcomings of modern portfolio risk management tools in our 2007 special report, Risk, Return, and Reality. Given the carnage of the past month, we feel it is appropriate to revisit that analysis.
In Risk, Return, and Reality we wrote:
If investment returns really do follow a normal distribution pattern [as portfolio models assume], then the 1987 crash never should have happened—literally not once in over 1 billion years. The problem is that the stock market is full of “once every billion years” days, even though we have only about 80 to 100 years’ worth of reliable data. So, what does that actually mean? Suffice it to say, the returns of the stock market are not normally distributed. This means that mainstream investment tools are flawed.
Chart 1: Stock Returns, Normal Distribution Assumed
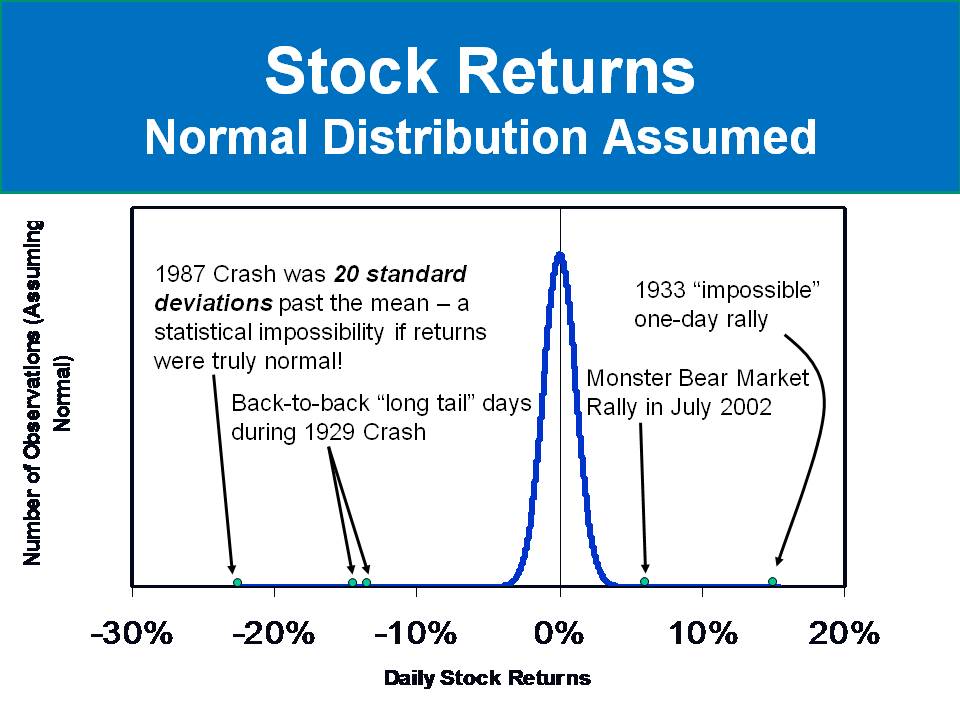
Chart 1 illustrates how truly unfit for the stock market the normal “bell” curve is. The 1987 crash was a full 20 standard deviations from the mean. This is a statistical impossibility if you accept one of the central tenets of modern portfolio theory: that stock returns are, in fact, normally distributed and thus able to be accurately modeled using common statistical methods. On October 13, 2008, the Dow rose 11% in one day. No one would complain about this outcome (unless they happened to be short at the time), but at 10 standard deviations from the mean, it was also a virtual statistical impossibility. 99% of all daily stock movements should fall between -3 and +3 standard deviations, meaning that only 1% of trading days should fall outside of that range. In the month between September 15 and October 15, 10 of the 23 trading days fell outside of that range!
This brings us to the two other major shortcoming of modern portfolio theory. The normal distribution assumes homoskedasticity and independence, which means that volatility is more or less constant over time and that returns from one day (or any other time period) do not influence the returns of another day. Each move of the market is random and unaffected by prior movements, happening in a vacuum.
This is patently false, as Charts 2 and 3 make abundantly clear. Chart 2 shows daily price movements in the Dow going back to 1928. Over the past 80 years, volatility has been anything but constant. Furthermore, extreme “down” days tend to be followed shortly by extreme “up” days, and vice versa, indicating that past movements do affect future movements.
Chart 2: Daily Price Changes, DJIA 1928-2010

Chart 3 gives us a look at a shorter time period, starting in 1997. During this period, we have seen distinct phases of rising and falling volatility. These cycles are self-perpetuating (and ultimately self-correcting), making the idea of independence laughable. After the last significant bear market, ending in late 2002, stocks entered a period of low volatility. This period of low volatility encouraged market participants to take more risk. (This follows the view of economist Hyman Minsky that stability inherently leads to instability, as it induces excessive risk-taking behavior.) After all, if the market is in a period of relative calm, why not juice your returns by adding a little leverage to the mix?
Chart 3: Daily Price Changes, DJIA 1997-2008

The results read like something out of a medieval morality play. Taking advantage of a period of low risk and low interest rates, market participants confidently assumed greater and greater risk in the form of higher and higher leverage. This was especially true in the mortgage market, which was the root of the 2007-2008 credit crisis. A house is a “safe” asset, so why bother worrying whether the mortgage can be repaid? The increase in leverage in the system inevitably meant that any mild uptick in volatility would be amplified. In the end, as Minsky would have predicted, the period of low volatility led to increasingly reckless behavior by market participants, which led to the meltdown of 2008 and its wild volatility.
In the aftermath of the crash, we are likely entering a prolonged period of reduced risk appetites and increased risk premiums. Though LIBOR is starting to fall to a more normal level at the time of this writing, it still remains high, indicating that banks demand more return for a given level of risk, even from each other. Rates for corporate borrowers and retail consumers also remain high relative to the benchmark U.S. government rates, to which anyone in the market for an auto loan or mortgage can attest.
Risk seeking behavior is passé; conservative and stodgy are the new cool. No-document “liar loans” have taken their place on the scrap heap of financial history, where they belong. “Structured finance,” the technical name for the Wall Street money factory that gave us the alphabet soup of mortgage-based products such as MBS, CDOs, CMOs, and SIVs is here to stay; securitization is profitable and effectively disperses risk, if done in a responsible manner. However, the reckless abandon with which it was practiced during the mid-2000s is likely dead for years to come, replaced with more restraint and by calls for increased regulation.
Nassim Nicholas Taleb would no doubt argue that the subprime lending debacle proves that the entire foundation of modern portfolio theory should be scrapped because it is based on false premises, as we discussed above. Stock returns are not normally distributed. Black Swan externalities, such as the mortgage meltdown, the September 11, 2001, terror attacks, the Internet boom and bust of the late 1990s and early 2000s, the long-term capital management failure in 1998, and the 1987 “portfolio insurance” crash, all prove the contrary. Nearly all mainstream asset allocation models use past data to predict future returns. This simply isn’t good enough, as there is no way to know when the next Black Swan will hit or what it will be, let alone what effect it will have on your asset classes. “Past performance is no guarantee of future returns.”
While we largely agree with Taleb in principle, we are not quite ready to throw modern portfolio theory out the window. The creation of modern quantitative finance by Professors Black, Scholes, Merton, Markowitz, Sharpe, and the legions of other early “quants” has real value. If used with a proper understanding of its limitations and while keeping in mind that Black Swans will happen from time to time, modern portfolio theory can be a useful tool for allocating your investment capital —but it is not enough.
The best advice we can offer is to be honest with yourself about how much of your net worth you can tolerate to put at risk and to keep in mind that however your assets are allocated, you are probably taking more risk than you think you are.
A lot of ink has been spilt trying to make sense of the past month. In the pages to follow, we’re going to take a look at some of the more insightful comments we’ve found in the financial press.
Black Swans in the Press
Writing for the Wall Street Journal, Gordon Crovitz asks valid questions:
…[T]he most paralyzing loss of trust may be in Wall Street’s system itself: How did the smartest people at the best banks running the most sophisticated financial models fail to forecast the collapse of mortgage-related securities? How did this unpredicted collapse devastate the system? And most of all, can we ever again trust the financial models on which value is supposed to be determined?
These questions matter because despite the current crisis, modern finance has delivered enormous benefits, from explaining to investors why they should diversify their investments to the creation of mutual and index funds. Related innovations helped financial institutions speed capital to its best use, fund new businesses and accelerate global prosperity. In other words, financial engineering worked beautifully—until suddenly it didn’t.
Mr. Crovitz states what all traders instinctively already know. Investors are often not rational. They are driven by human emotion and are subject to oscillating extremes of greed and fear. Furthermore, the system is affected by “noneconomic” motivations such as altruism or ideology. Sterile academic models cannot cope with illogical and uneconomic factors. As Crovitz writes, “Washington’s insistence for years on artificial subsidies for mortgages through Freddie Mac, Fannie Mae and other programs led to a loud ‘Does not compute!’ that is still rocking the financial system.”
Crovitz makes the “value-at-risk” (VaR) risk management tool the focus of his criticism. VaR is yet another overly complex model that lured bankers into a false sense of security. Despite its elegance and sophistication, VaR is still based on the normal distribution, meaning that it cannot account for “fat tails,” among other shortcomings of the normal distribution. Crovitz quotes the work of Benoit Mandelbrot, whom we also reference in Risk, Return, and Reality. Dr. Mandelbrot’s work has never been more appropriate than it is today.
Jeremy Siegel, author of Stocks for the Long Run, had interesting comments in the Financial Times this month. In the inflation vs. deflation debate, HS Dent was virtually alone for most of 2008 in forecasting that deflation would be the greater concern in the years to come. In light of the year’s events, Jeremy Siegel has moved firmly into our camp. Dr. Siegel wrote:
Many believe the unrestricted provision of liquidity is highly inflationary. But this need not be the case. The current rush to liquidity is not motivated by the desire to buy goods and services, but to avoid capital losses on existing investments. The sharp drop in commodity prices shows this liquidity surge is deflationary, not inflationary. When confidence returns to the financial system, the central bank can withdraw the liquidity by raising interest rates to normal levels.
The second, more difficult issue feeding this crisis is the unwillingness of the banks to lend to each other or the private sector….This is an example of the liquidity trap that Keynes said characterised the Great Depression. The credit markets have shut down because the fear of default overwhelms any expected profit from lending even if borrowing costs are nil.
We have been throwing around phrases like “liquidity trap” and “pushing on a string” for several years now, generally in describing the experience of the Japanese in the 1990s and early 2000s. Now, the United States and Europe are experiencing this for the first time since the Great Depression. We expect the data to be noisy, confusing, and full of conflicting signals in the volatile months to come. The stimulus package may briefly reignite inflation, or at least the perception of inflation. We expect any resurgence to be brief, however. Deflation is our primary worry for the next several years to come.
Speaking of Japan, Michiyo Nakamoto had relevant commentary in the Financial Times as well. Mr. Nakamoto writes:
For Japanese banks, the crisis that western banks are facing must seem like a fast-forward version of the nightmare they finally extricated themselves from just a few years ago.
Throughout the 1990s, Japan’s banking sector suffered the consequences of irresponsible lending, mainly related to real estate, which led to ballooning bad debts and eventually, a credit crunch.
The crisis was aggravated by slumping stock prices, with banks’ shares hit hard as a result of their growing non-performing loans and a lack of transparency about the real state of their bad debt holdings.
U.S. financial firms and government regulators have been very careful not to fall into the same slow-motion economic death spiral as Japan. For the most part, the American firms have been quick to realize their losses from the mortgage debacle, and they have moved quickly to recapitalize. The Japanese remained in denial for far too long, which prolonged their crisis and prevented the market from healing itself.
This could mean that the U.S. system will remain mired in crisis for a shorter period of time, but it absolutely does not mean that a quick recovery is at hand. The United States, like Japan before us, faces a decade ahead of slowing consumer spending due to the aging of the Baby Boomers. A purging of bank balance sheets will alleviate the immediate sense of crisis, but it will not spur a new surge in consumer spending. Unlike 2002, American consumers will not save us with a debt-fueled binge on new homes, cars, and plasma TVs. We are in a new era.
When Markets Collide
Pimco’s Mohamed El-Erian published a new book in 2008, When Markets Collide. The book is somewhat dense and at times seems to lack direction, but it still definitely is worth reading. Mohamed El-Erian is one of the sharpest minds in finance today, and his words should be taken seriously. We disagree with some of his conclusions (such as that labor supply constraints in Asia point to higher inflation…we could not disagree more), but in general we find his comments insightful.
Not surprisingly, Mr. El-Erian has his own comments on Black Swans; he believes that they are inevitable given the transformational changes happening in the global economy:
Nassim Taleb’s work is consistent with the hypothesis that the transformations increase the probability of “Black Swans” for which market participants are already ill equipped to deal with, in part because they are largely underinsured against “fat tails” events. Indeed, his work illustrates the traditional probabilistic approach…underestimates the tails.
El-Erian notes that quantitative “black box” models are particularly ill-equipped to survive in this environment and are prone to falling victim to the Black Swan. El Erian writes:
Consider the case of statistical arbitrage (‘stat arb’)…hedge fund strategies that had particularly difficult situations: The causes of the disruptions came from outside these market segments. Those funds that were most impacted were vulnerable on account of one or several of the following factors: leverage, maturity mismatches, lack of term financing, and client redemptions.
The basic root cause of all bank runs in history has never changed. At heart, the funding mismatch of borrowing short-term and lending long-term creates a combustible situation. A close cousin to this is the “carry trade,” which also got wildly out of control during the boom. Hedge funds sold yen and Swiss francs and put the proceeds into high-yielding currencies like the Aussie and Kiwi dollars and the Icelandic krona. Of course, these are small, relatively illiquid currencies, so any small reversal in this trade’s profitability would potentially lead to a stampede out of the door as the carry trade “unwound.” This is exactly what came to pass in 2008, as virtually all of the carry-trade gains of the past decade evaporate nearly instantly.
Finally, El Erian writes of the “debt-deflation spiral,” first articulated by the economists Hyman Minsky and Irving Fisher during the Great Depression. As the value of collateral falls, lenders become more cautious with respect to both existing and future loans. The loss of available credit removes the means to finance current consumption, thus causing prices to fall. This is no longer academic conjecture or a historical footnote; we are living through it now.
By now, there should be no question that the risk management tools used by the financial services industry are fundamentally flawed. The 1998 Long-Term Capital Management debacle was a narrowly-avoided potential meltdown in which stability was restored at the last minute by the Federal Reserve and the major Wall Street banks acting in concert. The 1998 would-be meltdown should have been an adequate warning signal, but it is now obvious, 10 years and the wholesale destruction of the banking sector later, that lessons were not learned. 2008 gave us the meltdown that should have happened in 1998, only orders of magnitude bigger. Future historians may look back at 2008 as the watershed year in which the role of quantitative finance in risk management was fundamentally rethought. Messrs. Mandelbrot and Taleb certainly reserve the right to say “I told you so.”
References
- Crovitz, Gordon. The 1% Panic. Wall Street Journal, October 13, 2008.
- Mandelbrot, Benoit. The (Mis)Behavior of Markets. Basic Books; New York, NY, 2004.
- Siegel, Jeremy. Liquidity and lending rates are crucial to confidence. Financial Times, October 15, 2008.
- Nakamoto, Michiyo. For Japan it must look like a question of history repeating itself, but with western groups taking the pain. Financial Times, October 15, 2008.
- El-Erian, Mohamed. When Markets Collide. McGraw–Hill Publishing, New York, NY, 2008.